Investment Review
Scott C. Malpass
Vice President and Chief Investment Officer
"The University has continued, in the face of these challenges, to 'invest' in faculty and programs and to provide financial aid to help meet the needs of our phenomenal students and their families."
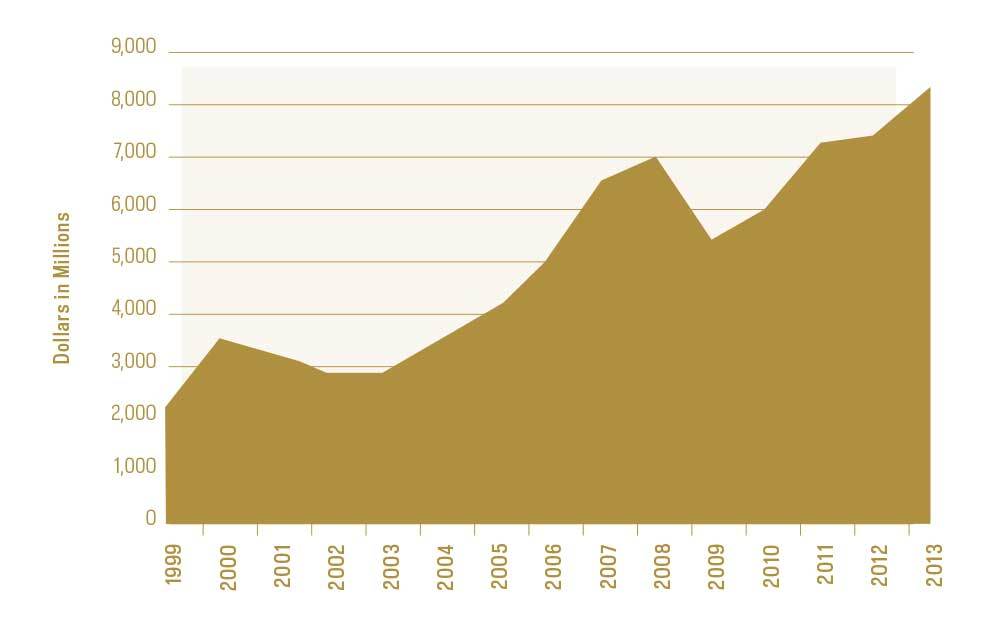
The Notre Dame Endowment Pool returned 11.8 percent, net of investment management fees, for the fiscal year ended June 30, 2013. The market value at year-end stood at $8.32 billion, up from $7.41 billion at the end of the prior year.
Endowment Pool
Market Value
As of June 30

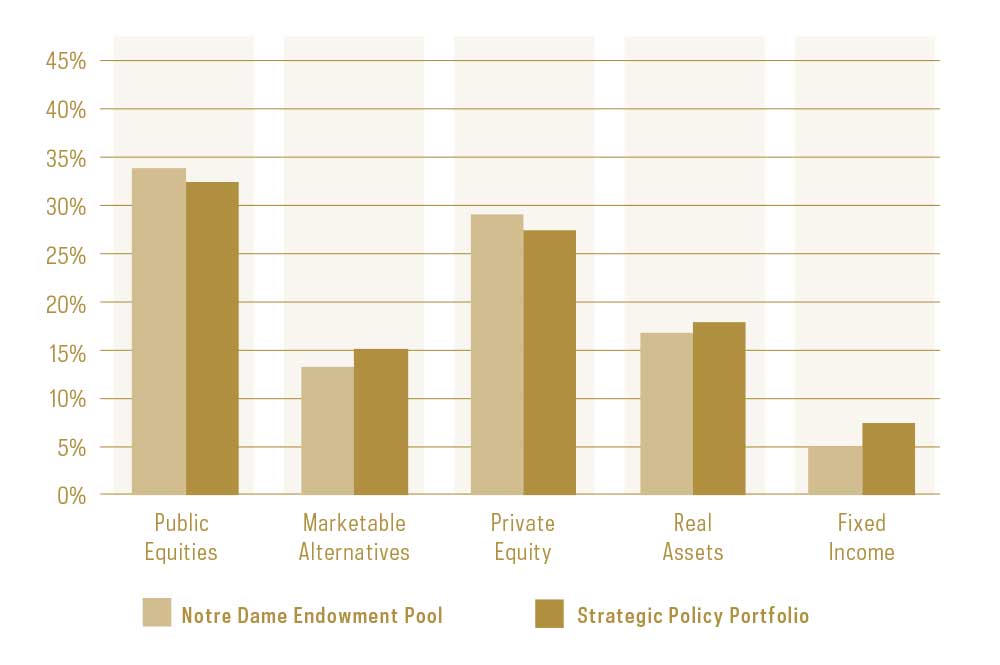
Public Equities and Marketable Alternatives were particularly strong contributors to returns during the year, and even as emerging markets generally struggled, many of our active managers significantly outperformed benchmarks in their respective countries and regions. Private Equity continued its long-term outperformance relative to its benchmark as well, and provided liquidity as distributions increased significantly compared to the prior year. Investment performance history compared to benchmarks, and asset allocation compared to the Strategic Policy Portfolio targets at the end of the fiscal year, are shown in the accompanying charts.
Endowment Pool Investment Performance
(Annualized Returns Net of Fees)
Periods Ended June 30, 2013

Endowment Pool Asset Allocation
As of June 30, 2013

The Strategic Policy Portfolio (SPP) is Notre Dame’s internal benchmark consisting of indices representative of the target investment portfolio. The Trust Universe Comparison Service (TUCS) Large Fund Median is a compilation of returns of endowment, pension and foundation investors greater than $1 billion and thus provides a basis for comparison to the performance of large institutional investors generally. The 60/40 mix is an index blend of stocks/bonds as represented by the MSCI All Country World Investable Index and the Barclays Capital U.S. Aggregate Bond Index and thus is a measure of performance compared to a more traditional or retail portfolio.
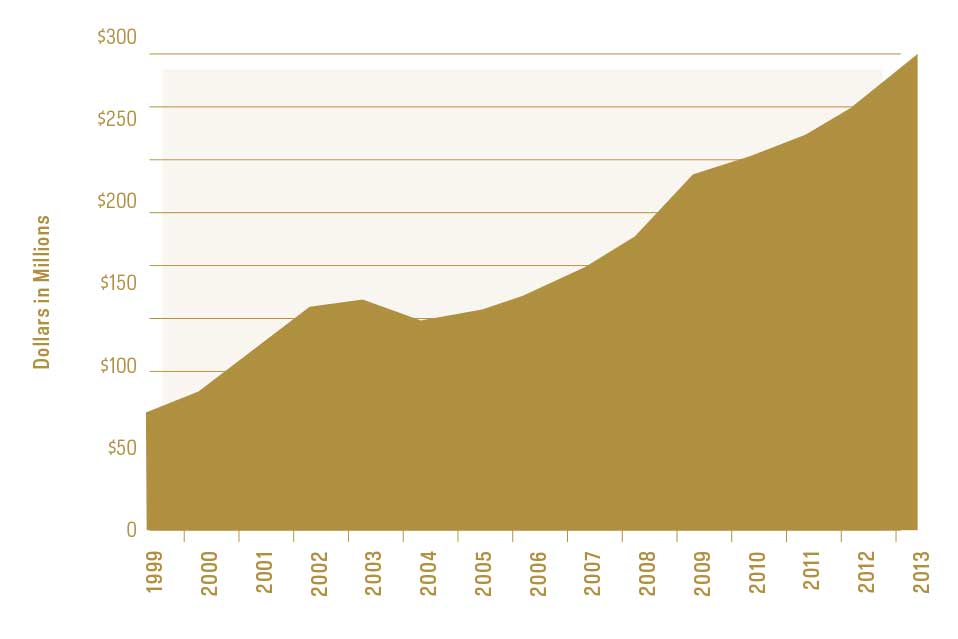
The last several years of course have been particularly challenging and volatile, and many areas of uncertainty remain troubling to investors. But thanks to the generosity of so many dedicated donors over the years and the growth in resources provided by strong long-term investment returns, and to judicious spending strategies, the University has continued in the face of these challenges to “invest” in faculty and programs and to provide financial aid to help meet the needs of our phenomenal students and their families. In fiscal 2013, Endowment Pool spending in support of these activities continued to grow, exceeding $286 million. This was an increase of 10.8 percent over the prior year and equated to 25 percent of the University’s expenditures during the fiscal year. Nearly 32 percent of the amount distributed during the year was directed to scholarships and fellowships.
Endowment Pool Spending
Fiscal Years Ended June 30

With our very long time horizon, we continue to be value investors and remain focused on quality managers, diversification and liquidity to take advantage of opportunities as they arise. This approach has served us well in all sorts of market environments, and the accompanying chart shows the value added over the last 25 years from the University’s investment management program compared to the broad U.S. equity market. The Endowment Pool is more than $3.6 billion larger than it would have been had returns equaled that benchmark.
July 1, 1988 - June 30, 2013

These solid risk-adjusted returns have benefited the University in so many important ways, and have helped build the financial foundation for Notre Dame’s promising future.

